How Walthamstow Outperformed London in 2026
Here is a number that should not be possible: the Greater London house price index is down 3.3% year on year. Walthamstow is up 5.9%. Same capital city, same twelve-month window, same dataset. A 9.2-percentage-point divergence inside one urban market is not normal — and what the lender pool is doing about it is exactly the question every developer underwriting an E17 site needs to answer in 2026.
This piece is the quick version of that answer. What is driving the outperformance, what the £650 per square foot viability test is doing to the rest of London, and the rates senior, stretched senior, mezzanine and bridging are actually quoting on a Walthamstow scheme right now.
Watch the full data-led breakdown: Walthamstow +5.9% on YouTube.
The transport thesis is doing the work
Walthamstow sits at the meeting point of three planning-led catalysts. The Victoria Line terminus at Walthamstow Central. The Overground from Liverpool Street to Chingford. The South Tottenham orbital. West of Forest Road, sites also pick up Elizabeth Line spillover via the Liverpool Street interchange into the City and onwards to Canary Wharf.
PTAL ratings climbed measurably across the borough through 2024 and 2025 as Overground service patterns were upgraded. The planning system is now pricing connectivity into permission decisions at a level it did not five years ago.
The downstream effect for capital partners is a single sentence: well-connected brownfield in E17 is now financeable on schemes that would not pencil two miles further out. The borough’s GDV ceiling is no longer pinned to its pre-2024 average. Adjacent corridors picking up the same dynamic include Leytonstone, Stratford, and Ilford on the Elizabeth Line.
Reading the +5.9% in context
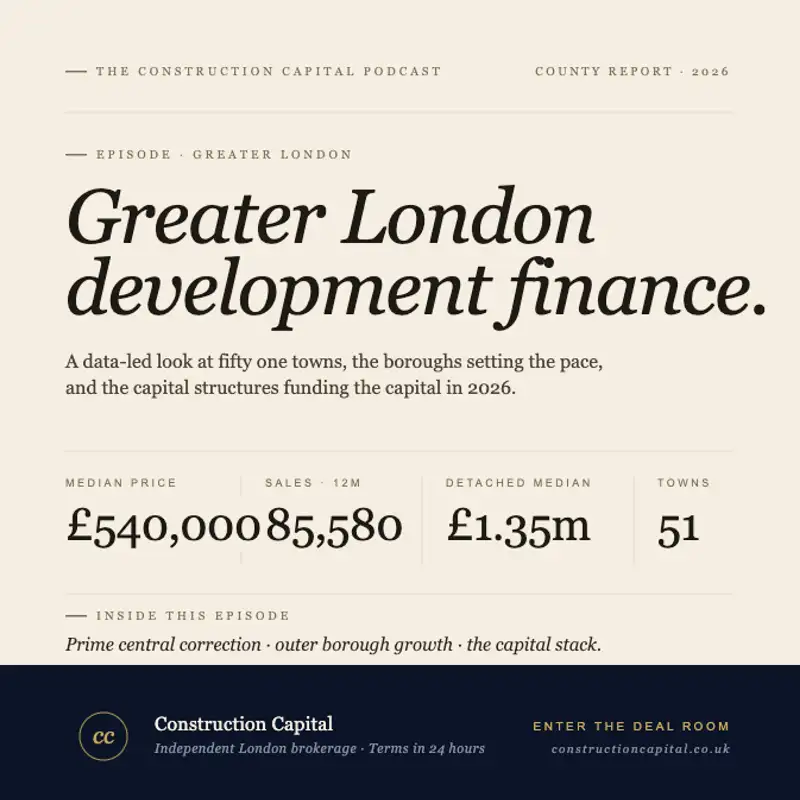
To put the +5.9% in proper context: Greater London’s median across 51 principal towns was £540,000 across 85,580 transactions in the rolling twelve months to February 2026. New-build completions were 1.9% of that activity. The regional average sits at £542,000.
Three things are happening underneath Walthamstow’s outperformance against that backdrop.
Demand depth comes first. The borough’s price growth is being driven by buyers who would have bought in Hackney or Stoke Newington a decade ago, where comparable square footage now trades 30%-plus above what the same product sells for in E17. That migration is structural, not a single-cycle blip. The same pattern is showing up in Redbridge (+5.3%), Bromley (+3.0%), and Croydon (+2.5%).
Then supply discipline. Forty-eight months of planning friction around the Walthamstow Town Centre AAP held back completions through the back end of the last cycle. The pipeline is now releasing through the post-NPPF reform regime introduced in December 2024 and tightened in the second consultation that closed in March 2026.
And then land economics. Recent off-market trades indicate residual values that sit above £650 per square foot — Molior’s threshold separating viable from undeliverable for most of the capital. Of the 281,000 unbuilt consented homes across Greater London, only 119,200 sit above that line. A meaningful share of those are in connected outer boroughs. The contrast against prime central is stark — Kensington and Chelsea are down 11.2%, Westminster is down 10.8% over the same window.
What lenders are pricing in 2026
Following the Bank of England’s December 2025 cut to 3.75%, the all-in capital stack on a typical Walthamstow scheme is in the tightest band we have seen since 2022.
The headline numbers: senior development finance starts from 6.5% per annum at 65% to 70% LTGDV for an experienced developer with strong cost certainty. Stretched senior begins around 7.5% and reaches into the high single digits at higher leverage tiers. Mezzanine finance prices from 12% per annum and stretches gearing to 85% to 90% of cost. Bridging loans on auction acquisitions and pre-planning sites start at 0.55% per month at up to 75% LTV.
For a scheme with the right specification in the right micro-location, blended all-in pricing now sits in the 6.5% to 9.5% range. That is the operative number for any Walthamstow viability appraisal in this rate environment.
What is actually transacting
Three categories of scheme are moving forward across Walthamstow in 2026.
First — outer-borough intensification on transport-adjacent brownfield. Sites within a 10-minute walk of any of the three rail nodes are clearing higher GDVs than equivalent sites elsewhere in the borough, and the senior-debt market is comfortable lending on densities at the upper end of the new London Plan parameters where transport access supports it. Barking, Lewisham and Woolwich work to the same playbook.
Second — mid-rise residential, typically 6 to 12 storeys, often with a meaningful PBSA, BTR or co-living component in the mix. The Greater London PBSA pipeline now stands at 14,600 beds under construction — the largest of any UK city. The borough’s proximity to multiple east London university campuses puts it firmly in the lender appetite zone for that asset class. London BTR starts collapsed by 93% between 2022 and 2025, but the institutional re-entry is happening earliest in connected outer boroughs.
Third — selective regeneration platforms tied into the Mayor’s emergency housebuilding package and the new Time-Limited Planning Route at 20% affordable housing by habitable room. The Time-Limited Route is, in effect, a fast-track for schemes that accept the lower affordable share and hit a defined delivery cadence. Several Walthamstow sites are early candidates.
How the capital stack works on a £15m GDV scheme
A typical Walthamstow site at this scale, with strong PTAL and a clean planning consent under the new NPPF regime, finances conventionally: senior development finance at 65% LTGDV (around 6.5% to 7%), mezzanine layered to 90% of cost (12% plus), and modest equity or JV equity to close the gap.
On the same scheme one borough further out, the senior layer would price 50 to 100 basis points higher and mezzanine appetite would thin meaningfully. The transport-and-lender feedback loop is now that direct.
The maths gets sharper still on slightly larger schemes — £25m to £60m GDV. The institutional senior pool re-engages at that scale. Mezzanine providers compete for allocation. Forward-funding conversations with BTR operators come back into view. That is the structural window the next twelve to eighteen months represent for Greater London development capital generally, and Walthamstow specifically.
What this means for site acquisition decisions
Three principles for any 2026 land appraisal in E17.
First — transport-driven micro-locations have moved from tie-breaker to threshold question. A site without sub-10-minute walk access to a meaningful rail node will struggle to clear viability irrespective of how well-priced the land is.
Second — the £650 per square foot test is binary. Lenders are using it as a hard filter on the GDV row of every appraisal. Sites that fail to clear it on credible market-comparable evidence are being declined at term-sheet stage.
Third — the post-NPPF planning regime, the second consultation outcome, the Mayor’s emergency package and the Time-Limited Route together favour schemes that move quickly. Capital is available for shovel-ready stock — whether through conventional development finance, bridging for a tight acquisition window, or a development exit refinance for a project completing in late 2026.
For full borough-by-borough sold price data, the regeneration pipeline references, viability modelling and the underlying capital stack benchmarks behind this analysis, see the Greater London Property Market Report 2026. Borough-specific intelligence sits on the Walthamstow location page.
See also: The £650/sq ft Cliff — full data-led breakdown on YouTube, the foundational viability question that shapes every London site appraisal in 2026.
Listen to the full episode
For the dedicated deep dive on Walthamstow, we have just published a stand-alone episode of the Construction Capital podcast: Walthamstow +5.9%: Why One London Borough Is Up While the City Falls. Eleven minutes covering the transport thesis, the £650 per square foot viability test, the full April 2026 capital stack, and what is actually transacting in 2026.
The wider context lives in Episode 2 of the Construction Capital podcast: Greater London Property Development Finance 2026: Market Analysis, House Prices and Lending Outlook. The full borough-level data, policy detail and capital stack discussion runs 15:30, with chapters covering Walthamstow, Redbridge, Bromley and Croydon within the wider Greater London outlook.
Listen anywhere
Listen on Apple Podcasts, Spotify, Overcast, Pocket Casts, or Amazon Music.
For indicative terms on a Walthamstow scheme within 24 hours, submit through the Construction Capital deal room.
Published by Construction Capital, an independent capital advisory brokerage sourcing terms from over 100 lenders across development finance, bridging, mezzanine, and equity. This article is part of a 20-piece Greater London 2026 series accompanying the Construction Capital podcast.